
 Welcome to the latest edition of “La Cañada Flintridge Market at a Glance.” In this blog post, we’ll dissect the real estate statistics for two distinct 30-day periods in 2023—the one ending on October 3 and the other on September 2. We aim to provide you with a comprehensive understanding of the local market, focusing on key metrics such as median list prices, average price per square foot, and market time.
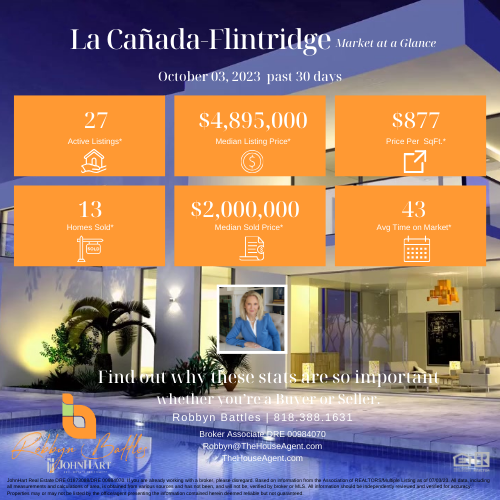
The Last 30 Days Ending on October 3, 2023
Key Metrics:
- Homes on the Market: 27
- The number of homes on the market has remained stable, indicating a balanced supply and demand.
- Median List Price: $4,895,000
- The increase in median list price suggests that sellers are optimistic about the market conditions.
- Average Price per Square Foot: $877
- A slight decrease in this metric indicates a more balanced market, possibly leaning towards buyers.
- Homes Sold: 13
- With 13 homes sold, the market appears to be moderately active, but not overly so.
- Median Sales Price: $2,000,000
- The median sales price has decreased, which could be attractive for potential buyers.
- Average Market Time: 43 days
- The longer market time suggests that homes take more time to sell, possibly due to pricing or other factors.
The Last 30 Days Ending on September 2, 2023
Key Metrics:
- Homes on the Market: 27
- The consistent number of homes indicates a stable market.
- Median List Price: $3,795,000
- A lower median list price in this period suggests a more buyer-friendly market.
- Average Price per Square Foot: $888
- A higher average price per square foot indicates that properties were generally more expensive on a per-square-foot basis.
- Homes Sold: 14
- A slightly higher number of homes sold indicates a more active market during this period.
- Median Sales Price: $2,237,500
- The higher median sales price suggests buyers would pay more for properties.
- Average Market Time: 14 days
- A shorter market time indicates that homes sold more quickly, suggesting a seller’s market.
Summary Comparison
While the number of homes on the market remained consistent, the median list price increased in the latest 30-day period. However, homes are taking longer to sell, as evidenced by the longer average market time.
Why These Stats Matter
- Market Time: This metric is invaluable for sellers and buyers as it helps gauge the pace of the market.
- Median Prices: These figures show the market’s general pricing trends.
- Average Price per Square Foot: This provides a more granular look at how much “house” you get for your money.
The Point of Sharing These Numbers
Sharing these statistics aims to offer you valuable context and actionable insights into the La Cañada Flintridge real estate market. Armed with this information, you can make more informed decisions, whether you’re looking to buy or sell.
Get In Touch
Intrigued by what you’ve read? Reach out to me, Robbyn, for a deeper dive into these statistics and what they could mean for you. Whether you’re buying or selling, I’m here to provide the market information you need. Call, text, or email me today!