
 If you’re curious about the real estate scene in the picturesque neighborhood of Shadow Hills, California, you’ve come to the right place. To understand the latest trends comprehensively, let’s dive into the market stats for two crucial 30-day periods, comparing October 16 and September 22.
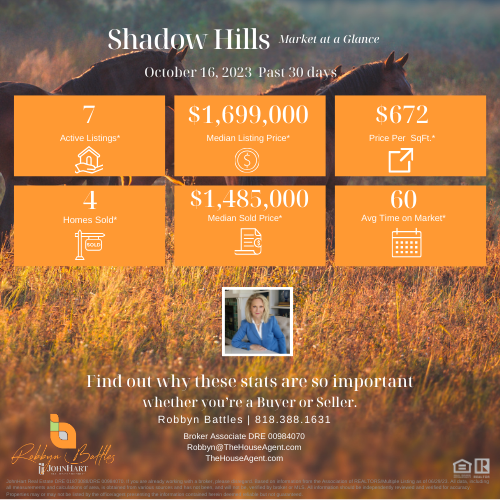
October 16 Stats:
- Homes for Sale: 7
- Median List Price: $1,699,000
- Average Price per Square Foot: $672
- Closed Sales (Previous 30 Days): 4
- Median Sale Price: $1,485,000
- Average Market Time: 60 days
September 22 Stats:
- Homes for Sale: 11
- Median List Price: $1,299,000
- Average Price per Square Foot: $650
- Closed Sales (Previous 30 Days): 5
- Median Sale Price: $950,000
- Average Market Time: 19 days
Now, let’s break these numbers down:
In October, Shadow Hills saw a decrease in the number of homes for sale, with 7 available compared to 11 in September. However, there’s a significant uptick in the median list price, rising from $1,299,000 in September to $1,699,000 in October. The average price per square foot has also increased slightly from $650 to $672, indicating a competitive market.
In terms of closed sales, there were 4 in October, with a median sale price of $1,485,000 and an average market time of 60 days. In September, 5 homes were sold, boasting a median sale price of $950,000 and an average market time of just 19 days. This suggests that while the market may have slowed down slightly, property values have continued to rise.
Now, let’s delve into why these stats are essential:
- Number of Homes for Sale: Knowing the number of homes available on the market gives buyers an idea of the available options. A decrease in this number (from 11 in September to 7 in October) can signify increased competition among buyers, potentially affecting pricing.
- Median List Price: The median list price indicates the midpoint of home prices in the market. The significant increase from $1,299,000 in September to $1,699,000 in October suggests a strong demand for properties in Shadow Hills, leading to higher listing prices.
- Average Price per Square Foot: This metric helps buyers understand the cost per living space unit. The slight increase from $650 to $672 indicates a rise in property values, which can impact budgeting for potential buyers.
- Closed Sales: Closed sales represent completed transactions. The drop from 5 sales in September to 4 in October, coupled with the longer average market time (60 days vs. 19 days), may suggest a slightly slower market pace. Buyers might have more negotiating power, and sellers should be prepared for longer listing periods.
- Median Sale Price: The median sale price provides insights into the actual prices buyers are willing to pay. The increase from $950,000 in September to $1,485,000 in October signifies a positive trend in property values.
Understanding these stats is crucial because they help both buyers and sellers make informed decisions. Buyers can gauge the market’s competitiveness and pricing trends, while sellers can adjust their strategies based on the number of homes available and current pricing dynamics. These stats offer a snapshot of the Shadow Hills real estate market’s health and direction, empowering individuals to make well-informed real estate choices.
Shadow Hills, nestled in the foothills of California, offers a unique blend of a country feel and equestrian charm. With wide-open spaces and a large equestrian community, it’s the perfect place for horse enthusiasts and those seeking a serene suburban lifestyle. Surrounded by natural beauty and scenic landscapes, this neighborhood is a hidden gem in the Los Angeles area.